Ein sehr einfaches agentenbasiertes Modell für Marktanteils- und Cluster-Dynamik (dt. Übersicht)
In einem einfachen Modell (weitere Details siehe Appendix) beeinflussen die Neigung, von einem Dienst zu einem anderen zu wechseln oder nicht (Wahrscheinlichkeit, bei einem Dienst zu bleiben, „User Stickiness“), und die anfängliche räumliche Verteilung der Dienste die Entwicklung der Dienstleistungslandschaft, zum Beispiel:
- Bei zufälligen Startanordnungen, d.h. jeder Nutzer beginnt mit einem zufällig ausgewählten Dienst, hat eine erhöhte Nutzerbindung einen starken Effekt. In geordneteren Umgebungen kann der Effekt wesentlich geringer sein.
- Selbst bei gleicher Wechselneigung zwischen den Diensten führt eine zufällige Ausgangsanordnung zu größeren „Inseln“ der genutzten Dienste (größere räumliche Cluster).
- Die Zunahme der Clustergröße ist bei höhere Wechselneigung größer/schneller.
Dies könnte darauf hindeuten, dass räumliche Anordnungen (oder deren äquivalente soziale Interaktionen) sowie die Wechselneigung bei einem Dienst für die Gewinnung von Nutzern oder die Gestaltung von Kampagnen von Bedeutung sein könnten. Zum Beispiel könnte in Situationen, in denen die Kosten für die Änderung der Wechselneigung eher konstant sind und die Nutzung räumlich recht heterogen ist, die Konzentration auf bereits sehr loyale Nutzer vorteilhafter sein, wenn es darum geht, den Marktanteil im Kontext dieses einfachen Modells zu erhöhen. Ähnlich könnte eine frühzeitige heterogene Anordnung von Diensten andere Ansätze implizieren als eine späte, geclusterte Anordnung (im Kontext des hier Modells hier).
Spatial Arrangements and User Stickiness Might Matter—A Very Simple Agent-Based Model Of Market Share and Cluster Dynamics
In a simple model (see Appendix for more details), the propensity to switch or not from one service used to another (probability of staying with a service, “User Stickiness”) and the initial spatial distribution of the services have an effect on the evolution of the service landscape, for example:
- At random starting arrangements, i.e., each user starts with a randomly selected service, an increase in user stickiness has a strong effect. In more ordered settings, the effect can be much lower.
- Even at equal user stickiness between services, a random starting setting will order itself into larger “islands” of services used (larger spatial clusters).
- The increase in cluster size is larger/faster at lower user stickiness.
This could suggest that spatial arrangements (or their equivalent social interactions) as well as propensity to switch a service could matter for attracting users or designing campaigns. For example, in situations where the costs of changing user stickiness is rather constant and the use is spatially quite heterogeneous, focusing on already quite sticky users might be more beneficial when trying to increase market share within the context of the simple model here. Similarly, an early heterogenous setting of services might imply different approaches from a late, clustered setting (within the context of the model here).
Increase In User Stickiness Increases Share And Cluster Size Of The Service
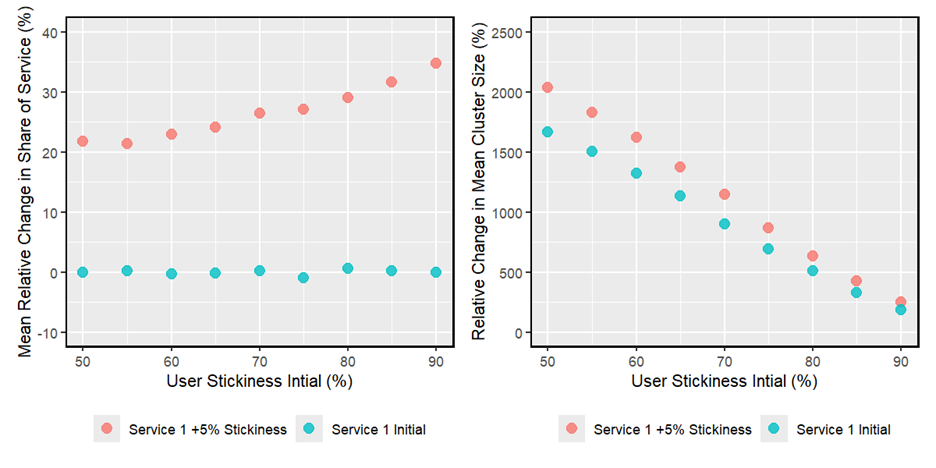
Increasing user stickiness of one service versus the others increases the share of the that service as well as the cluster size the service is used in. While the effect in the relative change in share of the service increases with the initial user stickiness (i.e., the baseline level of user stickiness of all services), the effect on the relative change in cluster size is decreasing with increase initial user stickiness (figure 1).
Figure 1: Effects of a 5%-point increase on relative change in share of service and cluster size—increased stickiness benefitting the respective service
User stickiness does also manifest itself in how fast an initial random configuration moves towards fairly well established clusters governed by one service: at low user stickiness these domains form quickly while at a high stickiness it takes time/the service landscape remains less clustered.
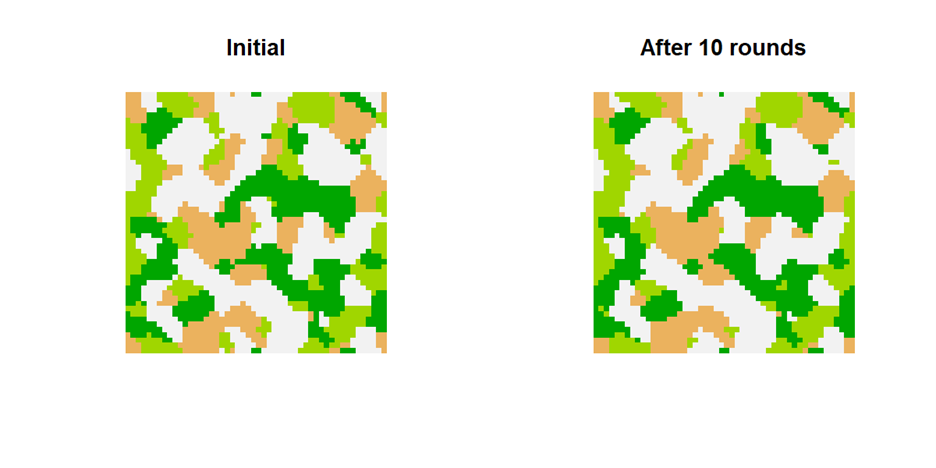
Figure 2a: Example of a change in service landscape at 50% user stickiness—larger clusters forming (different colors indicate different service choices)
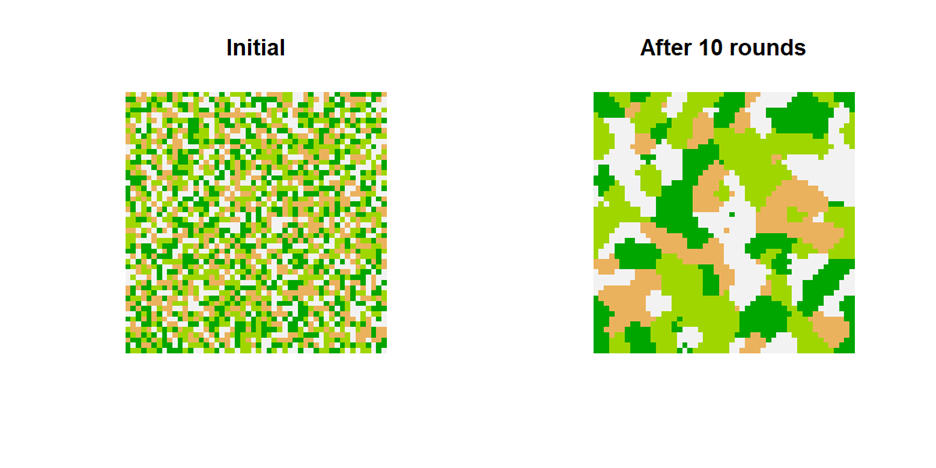
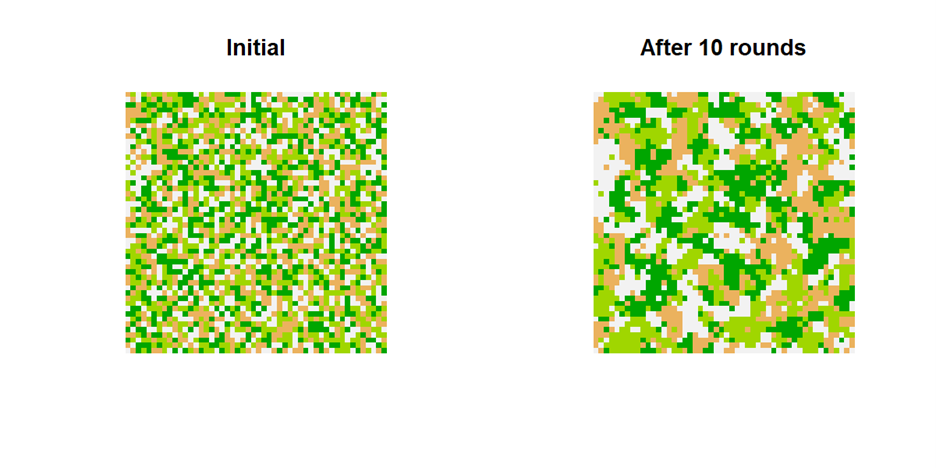
Figure 2b: Example of a change in service landscape at 90% user stickiness—clusters smaller (different colors indicate different service choices)
Clustered Starts Reduce The Effects Of Increases In User Stickiness
How effective would a change in user stickiness be if the starting point is a “clustered” grid such as the one above on the right? The overall direction of effects remains similar, however, the size of the effect on the relative share of the service with increased user stickiness is reduced, while the overall change in cluster sizes is also reduced (naturally as the start is already clustered), too, and the difference between base line stickiness and increased stickiness is strongly reduced.
Figure 3: Effects of a 5%-point increase on relative change in share of service and cluster size—clustered starting points create a muted effected from increased stickiness

Figure 4a: Example of a change in service landscape at 50% user stickiness—clustered start with still some cluster growth (different colors indicate different service choices)
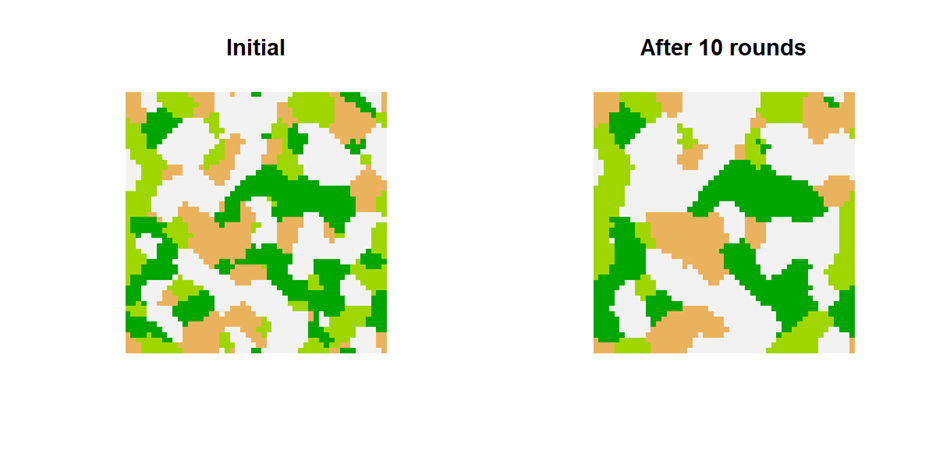
Figure 4b: Example a change in service landscape at 90% user stickiness—clustered start with limited effect (different colors indicate different service choices)
Wide Range Of Model Expansions Conceivable
There are endless iterations and variations possible even in this simple model, for instance:
- Different selection methods for a new service based on the neighborhood or other measures
- Different neighborhood designs
- A distribution for the stickiness and not just a single number
For smaller service landscapes with limited structure (let’s say a few million users or so) one could even imagine pretty complete models to be feasible, e.g., every user exists in it.
Appendix: Technical Model Setup
The underlying model is simple: it consists of 2500 discrete, simulated users on a square grid (50×50), so that each client has eight, fixed neighbors (the grid wraps around like the surface of donut).
Initially, each client uses one of four possible services which are randomly assigned at the start (or, alternatively, starting with a randomly selected more ordered landscape of services used).
The model then simulates rounds of possible switching of service providers:
- In each round a user can, with a certain probability, not consider a switch of the service at all.
If a user considers a switch it looks to its neighborhood to work out which provider to switch to:
- The number of occurrences of the various services in the eight neighbors is counted and the new services will be the one that is most frequent among the neighbors.
- If there is a tie, then the new service is chosen randomly from the tying providers.
- Note that even though a switch is considered, it could still result in staying with the original service if that one is prevalent in the neighborhood.
As a result of this, after each round the service provider landscape changes.
This process is repeated for a total of ten rounds. In order to investigate the effect of changes to user stickiness between services, we increase the stickiness for one service by 5% (for instance from 50% to 55%, i.e., the user is 5% less likely to consider a switch of service) and then measure the change in the number/proportion of users for that provider after the end of the ten rounds.
The whole ten round process is repeated 1000 times with different, random starting configurations for the service provider landscape.
Please note: While care was exercised in the creation of the simulations and the explanations, there might be errors and mistakes. Also, the model might not be suitable for any purpose.