When creating an estimate for a measure by, for example, averaging across a number of individual estimates to estimate a mean (along the lines of the “wisdom of the crowds”), how these individual estimates are related to each other could matter.
In a simple model (see below), increasing the correlation between the individual estimates makes the worst misestimations larger (here the max of over a number of absolute sample means). However, the sample means still average out to the “true” parameter in this model.
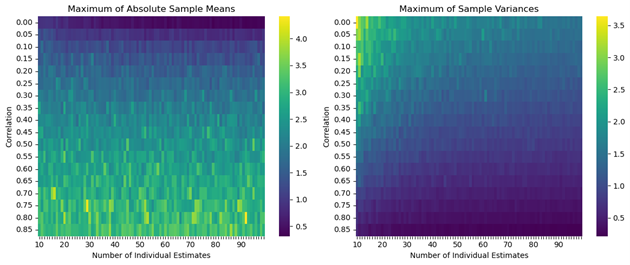
Increasing correlation in this model here increases the observed maximum (absolute) deviation of the average estimate from the mean (true mean is 0) while decreasing the observed maximum of the sample variances, i.e., the estimate might look “narrower” while it could be further off (Figure 1 shows the effects in this simple model). Also, small increases in the number of individual samples might have limited effects.
Figure 1: Effects of correlation on results from individual estimates—correlation could lead to worse outcomes
There are, of course, many more complexities in real world samples of estimates and their dependency structures (incl. independence) and unlike in the simple model here, the estimate could also be systematically biased away from the true parameter(s). Even perfect dependency, e.g., every individual using the same method to derive their estimate, need not necessarily be bad if the methodology is the correct one and correctly applied.
Model Setup
The model assumes a true mean of 0 but the individual estimates are randomly drawn from a multivariate normal distribution with the parameters below.
In this simple model here, the individual estimates are drawn from one multivariate normal distribution with means of 0, variances of 1, and a variable correlation. For each draw from the full multivariate distribution, the sample mean and variance is calculated.
There are 1000 draws from such distribution (per correlation) and then the maxima of the absolute sample means and the sample variances are computed.
In order to see the effect(s) of correlation between the individual estimates, the correlation of the multivariate normal distribution is varied between 0 and 0.85.
The effects of the number of individuals sampled is also looked at by considering numbers for the individual estimates between 10 and 99 (i.e., the number of dimensions of the multivariate normal distribution).
Please note: While care was exercised in the creation of the simulations and the explanations, there might be errors and mistakes. Also, the model might not be suitable for any purpose.